Finance
Finance overview
Finance → Overview answers the question that actually matters day to day: how much money came in, and how much did you pay back? Below that, it shows where the money came from. This is always about money your clients pay you — your own TrainerFoundry subscription runs separately, under Subscription & invoices.
Counted when the money arrives
This page works on a cash basis. That means an amount counts in the period it arrived in — not when you sold the offer, and not when the session is trained.
An example that makes the difference concrete: sell a ten-session pack in January that gets trained off through June, and the full amount shows up in January. None of it appears in the following months, even though you keep working. That's not a reporting bug — it's the view of your bank account, the same basis a cash-accounting trainer reports on. When the VAT/GST on it actually falls due is a question for your accountant.
Open payment requests correspondingly don't count until the client has actually paid. What's still outstanding is under Outstanding payments.
The three figures
- Received — Everything your clients paid you during the period — gross, card and cash together.
- Refunded — What you paid back to clients during the period, also gross.
- Balance — Received minus Refunded — the money you kept in the period, before tax and fees.
All three figures are gross. The page shows no VAT/GST, no net amount and no tax rate — the same for every tax scheme, whether standard-rated, small business (not registered) or exempt. The overview is your notebook for money coming in, not bookkeeping; that's why the line under the figures reads Your bookkeeping is authoritative. The tax inside a payment is on the invoice Stripe issued in your name for it; what you report to the tax office you work out with your bookkeeping or your accountant.
Nor are Stripe's own fees deducted from any of the three figures — Stripe bills those to you directly, see Receiving payments.
Period and grouping
When you open it, the page shows the current year: "From" is set to 1 January, "To" is today, grouped by month.
The Day, Week, Month and Year buttons aren't just chart bucketing — they're ready-made ranges: they set "From" to the start of the current day, week, month or year, "To" to today, and set the grouping to match. "Week" gives you the current week, not the trailing seven days.
Need a different window — say, the whole of last year — enter "From" and "To" directly. The grouping stays as it is; it only changes via the four buttons.
Both fields are required, both days count, and the period can span 1825 days (about 5 years) at most. If a date is missing, "From" is after "To" or the span is too long, the page shows no figures — just a message at the field concerned.
The trend chart
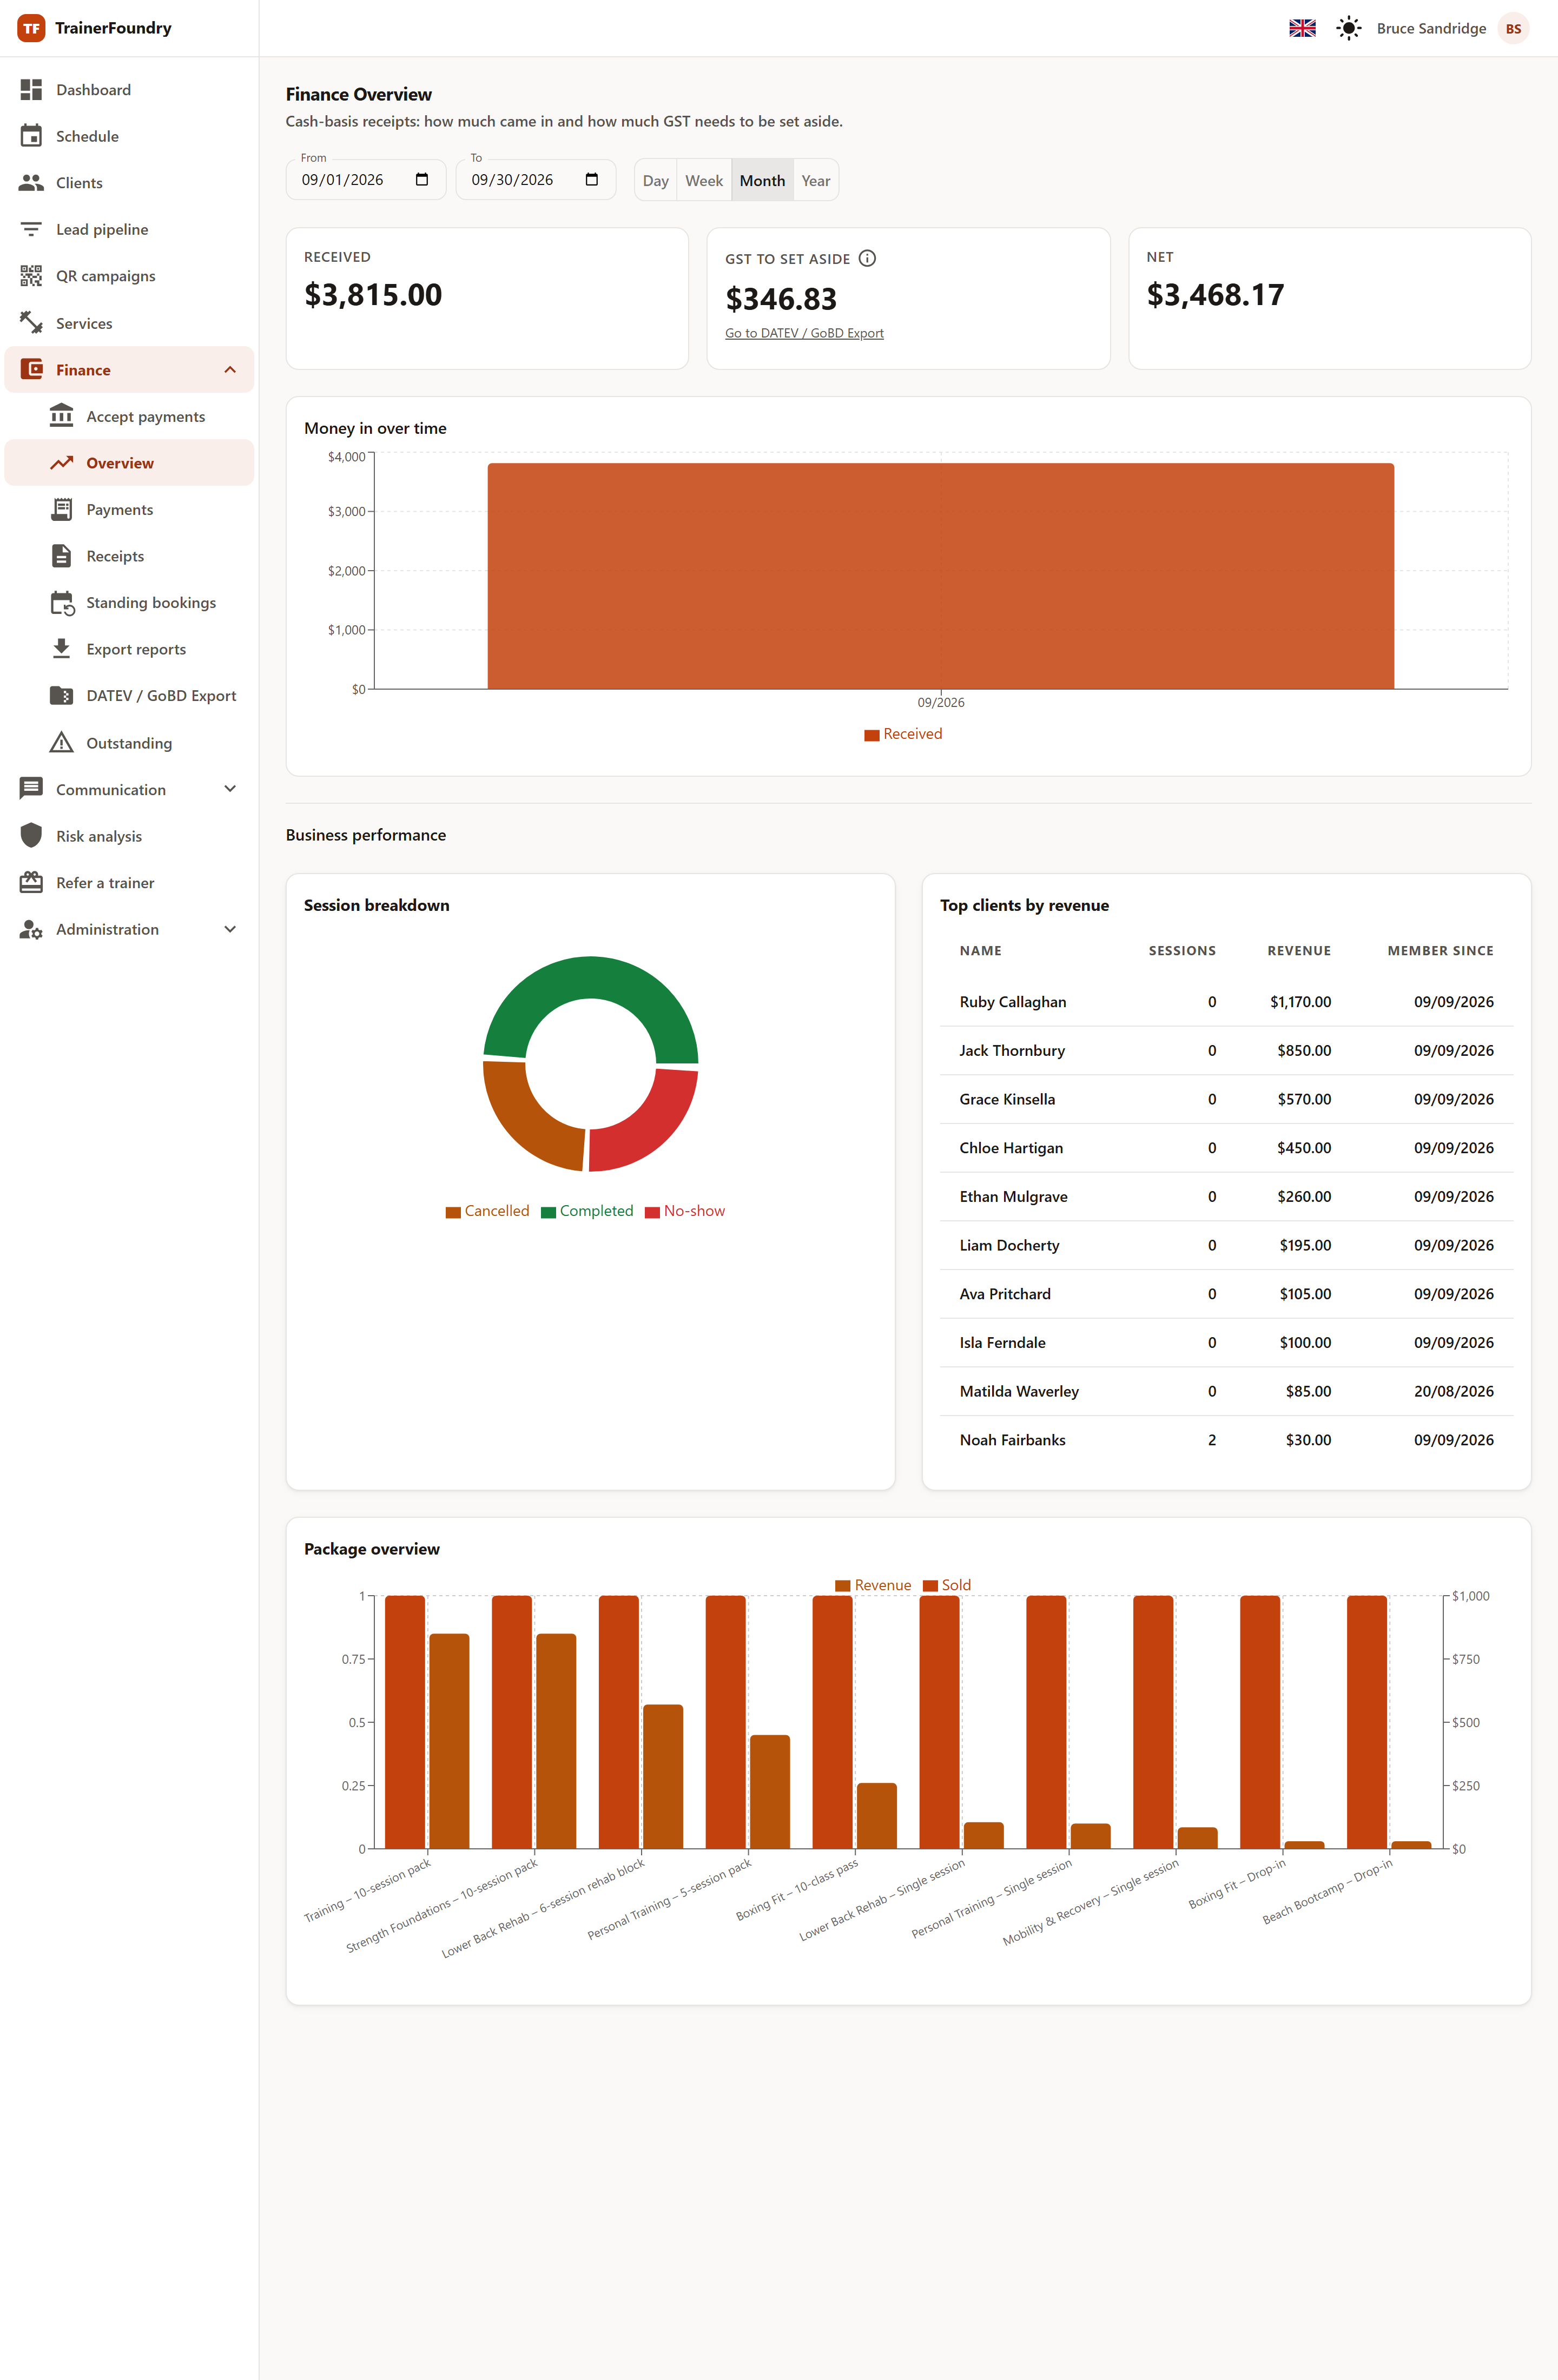
Below the figures, Money in over time shows the "Received" figure split across the chosen grouping. That's how you spot seasonality and the effect of promotions — and see whether a strong month came from many small payments or from one large package sale. A period with no payments at all still shows the chart, just with every bar at zero.
Business performance
The lower section answers the follow-up question: where did the money come from? It follows the same period as the figures above, and consists of three panels:
- Session breakdown — How many sessions were completed, cancelled or no-shows. A high “No-show” share is an early warning sign.
- Top clients by revenue — Who carries your business — with session count, revenue and the date they became your client ("Member since").
- Package overview — A bar chart of what you actually sold in the period — session packs, single sessions, and offers paid through a payment link or in cash — by offer name, with units sold on the left axis and revenue on the right, sorted by revenue descending. A since-deleted package or offer shows as "Unknown offer", but still counts toward its units and revenue. Ongoing membership charges don’t count here; you see those individually under Payments. Shows "No data" only when nothing of that kind was sold in the chosen period.
These panels load in a moment after the figures — the top band appears immediately, the section follows shortly after.
If you want to work with the numbers further, export them under Exporting reports as CSV. For your accountant, the CSV export lists every payment and refund in a period; the dedicated DATEV / GoBD export isn't available at the moment.